
Data Journey

Data Journey

The Data Journey is the full path your device data takes inside /IOTCONNECT™ — from the moment a device sends a reading, through validation and rule processing, into storage, and finally out to dashboards, exports, and predictions. This page walks you through every stage in plain language so you can see exactly what happens to your data and where.

Overview

Data Journey Overview

Every connected device produces data — temperature, humidity, pressure, GPS location, on/off status, and more. That continuous flow of sensor readings from your device to the /IOTCONNECT™ cloud is called telemetry, and it is the start of the Data Journey.

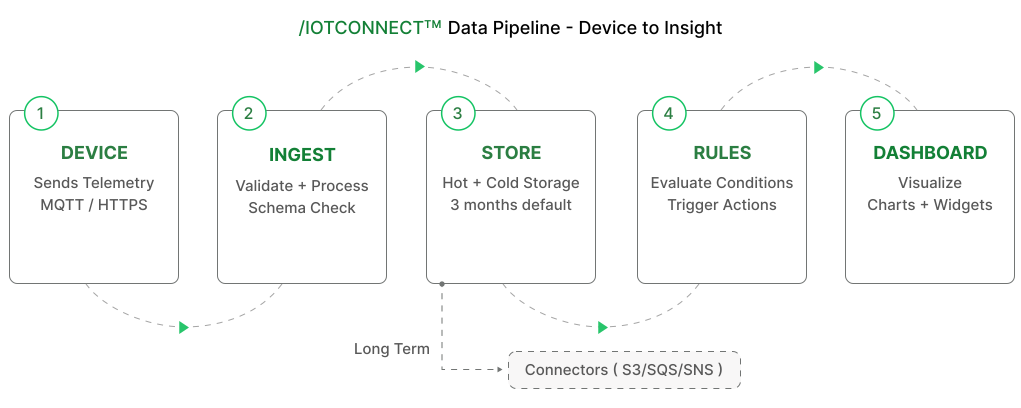
Here is the journey at a glance, from device to insight:

1. Ingestion: The device publishes its readings to the platform over the MQTT protocol, and /IOTCONNECT™ receives them in real time.

2. Processing: Each message is validated against the device template, then evaluated by the rule engine to trigger alerts and automated actions.

3. Storage: Valid data is saved so you can query recent values quickly and keep history for later analysis.

4. Export, Prediction & Visualization: Data flows out to your own storage through connectors, feeds machine-learning predictions, and appears on dashboards and charts.

The sections below explain each stage in detail.
Ingestion

Ingestion is the first step — how your device data actually gets into /IOTCONNECT™. Devices publish their readings to the platform continuously over the lightweight MQTT protocol, which is designed for IoT and works well even on low-bandwidth or unreliable networks.

Who sends the data: Any connected device — using the /IOTCONNECT™ SDK on real hardware, or the built-in device simulator for testing without hardware.

What is sent: A small message containing the device’s attribute values (for example temperature, humidity, status) at the interval you configure.

How fast: Ingestion handles high-frequency data from thousands of devices at once, with sub-second latency from the moment the device publishes to the moment the data is visible in the portal.

As soon as a message arrives, it moves straight into the Processing stage.

Processing

Once a message is ingested, /IOTCONNECT™ processes it in two steps: first it checks the data is valid, then it runs your rules against it.

Step 1 — Validation (the data filter): Every incoming message is checked against the device template. The platform confirms the message structure is correct and that each attribute matches the expected data type (for example, a temperature field must contain a number, not text).

Valid data passes the filter and continues on — it appears on the Live Data tab, is checked by the rule engine, and is saved to storage.

Faulty data — a message with unknown attribute names or a value whose type does not match the template — is separated out and recorded as a faulty message. It is kept aside for troubleshooting but is not shown as normal telemetry and is not evaluated by rules.

Step 2 — Rule evaluation: A rule watches your devices in near real time and reacts automatically when a condition is met. A rule has:

A condition: a simple expression on attribute values, such as temperature > 80. When an incoming reading makes the condition true, the rule is “matched”.

A scope: whether the rule applies to a single device, a whole entity, or every device on a template.

A severity and actions: when matched, the rule can send an email, raise a UI alert, or send a command back to the device — all tagged with a severity level.

Because rules only ever see valid data, a faulty reading can never trigger a false alert. This is why faulty data is filtered out before rule evaluation rather than after.

Storage

Storage

After validation, your data is stored so you can use it now and look back on it later. /IOTCONNECT™ provides two storage tiers to balance speed, cost, and how long data is kept:

Hot Storage: Optimized for real-time, low-latency access. Hot storage powers the Live Data tab, dashboard widgets, REST API queries, and rule evaluations, with sub-second response times. Default retention ranges from 7 to 90 days depending on your plan.

Cold Storage: Designed for long-term analytics, historical trends, and compliance archival. Cold storage keeps data for extended periods (months to years) at lower cost and can be queried through export tools or analytics connectors.

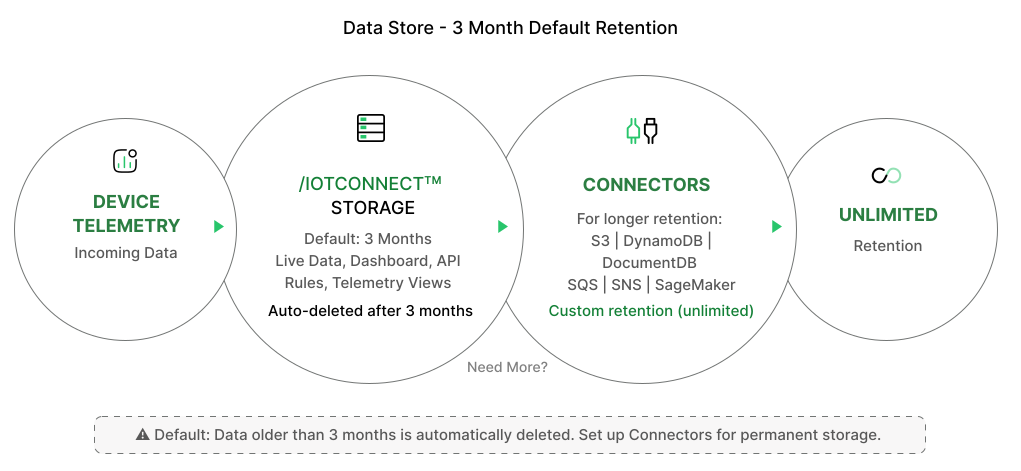
By default, /IOTCONNECT™ keeps your device telemetry for 3 months, after which it is automatically deleted. If you need to keep data longer, route it to your own storage using Connectors (described next).

Export Using Connectors

Connectors let you send your device data out of /IOTCONNECT™ and into your own cloud storage automatically, with zero custom code. This is how you keep data beyond the default retention period or feed it into your own analytics pipelines.

Where it goes: Choose a destination such as Amazon S3 for object storage and data lakes, DynamoDB for fast key-value lookups, or DocumentDB for flexible document queries.

What you can export: Different data types can be routed independently — Telemetry, Faulty data, Diagnostics, and Command History.

How to set it up: Enable the connector in Settings, pick the destination, and data flows automatically — no device-side changes are needed. Each connector provisions the required AWS resources and handles delivery, retries, and authentication for you.

See the Connectors documentation for the full list of destinations and setup steps.

Prediction

Beyond storing and showing data, /IOTCONNECT™ can help you predict what is likely to happen next. By feeding your historical device data into machine-learning models, you can move from simply reacting to problems to anticipating them.

Learn from history: Cold storage and connector exports give models a rich history of device behavior to learn from.

Common uses: Predictive maintenance (spotting a failing machine before it breaks), anomaly detection (flagging readings that look unusual), and forecasting (estimating future demand or load).

AWS SageMaker: Device data can be routed to Amazon SageMaker through a connector to train and run prediction models, and the results can flow back into the platform.

Visualization

Visualization is the final stage of the Data Journey — turning raw numbers into something you can read at a glance. /IOTCONNECT™ offers several ways to see your data:

Live Data tab: On any device, view the latest values, time-series graphs, or a tabular history of every reading.

Dashboards: Build custom dashboards from a library of widgets — gauges, charts, maps, and KPIs — to monitor fleets of devices in one place.

Alerts and notifications: Rule matches surface as UI alerts and emails, so important changes get noticed without staring at a screen.

Together, these views close the loop: data that started as a single device reading becomes a clear, actionable picture of your whole IoT solution.

ⓘ NOTE

Only valid data continues through the journey. Faulty messages (unknown attributes or wrong data types) are filtered out during processing — they are kept aside for troubleshooting but are never shown as normal telemetry and never trigger rules. /IOTCONNECT™ keeps telemetry for 3 months by default; use Connectors to retain data longer in your own storage.