
Telemetry

Telemetry

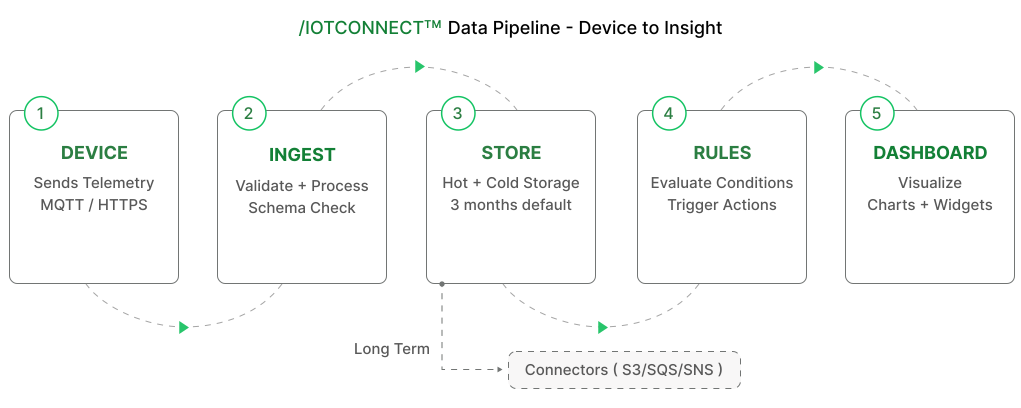
/IOTCONNECT™ Telemetry provides real-time device data ingestion and visualization. Sensor data flows continuously from connected devices to the cloud where it is validated, stored, and made available for monitoring, rule evaluation, and analytics.

What is Telemetry

Telemetry is the continuous flow of sensor data from IoT devices to the /IOTCONNECT™ cloud platform. Devices publish measurements such as temperature, humidity, pressure, GPS location, and operational status at configured intervals via MQTT protocol.

When a device sends telemetry, the platform validates the message structure and attribute data types against the device template. Valid data is immediately available for real-time monitoring on the Live Data tab, evaluated by the rule engine for condition-based automation, and persisted to storage for historical analysis.

Telemetry ingestion supports high-frequency data from thousands of concurrent devices with sub-second latency from device publish to portal visibility.

Viewing telemetry

Device telemetry can be viewed in real time from the device detail page under the Live Data tab. Three visualization modes are available:

Telemetry View: Displays the latest values for each attribute in a structured list format. Values update in real time as new messages arrive from the device. Ideal for quick status checks and monitoring current device state.

Graph View: Renders numeric attribute values as time-series line charts. Select one or more attributes to visualize trends over configurable time windows. Useful for spotting patterns, anomalies, and correlations between sensor readings.

Tabular View: Shows telemetry history as a paginated data table with timestamp, attribute name, and value columns. Supports filtering by date range and attribute. Best for detailed data inspection and export.

Quick Start

Follow these steps to start receiving and viewing device telemetry in /IOTCONNECT™:

Step 1: Create a Device Template with Attributes — Navigate to Devices > Templates and create a new template. Define the attributes (sensor fields) your device will send, specifying the data type for each (e.g., temperature as DECIMAL, status as STRING).

Step 2: Create a Device — Navigate to Devices > Devices and click Create Device. Select your template, provide a unique ID, and configure the authentication method (certificate or symmetric key).

Step 3: Connect Your Device or Use the Simulator — Connect your physical device using the /IOTCONNECT™ SDK, or use the built-in device simulator to generate test telemetry data immediately without hardware.

Step 4: Navigate to the Live Data Tab — Open the device detail page and click the Live Data tab. This is where real-time telemetry appears as your device sends messages.

Step 5: View Real-Time Data — Once the device is connected and sending data, telemetry values update in real time. Switch between Telemetry View, Graph View, and Tabular View to explore your data.

Data retention and storage

Telemetry data is retained based on your subscription plan and storage configuration. /IOTCONNECT™ supports two storage tiers:

Hot Storage — Recent telemetry data stored for fast, real-time queries. Hot storage powers the Live Data tab, dashboard widgets, and API queries. Default retention ranges from 7 to 90 days depending on your plan.

Cold Storage — Historical telemetry archived for long-term analytics and compliance. Cold storage data can be queried via export tools or connected analytics services. Retention can be configured from months to years.

You can also route telemetry to external storage via Connectors (S3, DynamoDB, DocumentDB) for custom retention and analytics pipelines. See the Connectors documentation for setup instructions.

ⓘ NOTE

Telemetry data is validated against the device template attributes. Messages containing unrecognized attribute names or mismatched data types are rejected and logged as faulty messages. Ensure your device template matches the data your device sends.